Install Prometheus and Grafana in your Kubernetes cluster

Share
Interests

What is Prometheus?
Prometheus is an open source systems monitoring toolkit originally developed by SoundCloud. Prometheus is now a part of the Cloud Native Computing Foundation and is managed independently of SoundCloud. Prometheus is the monitoring toolkit of choice for many Kubernetes users.
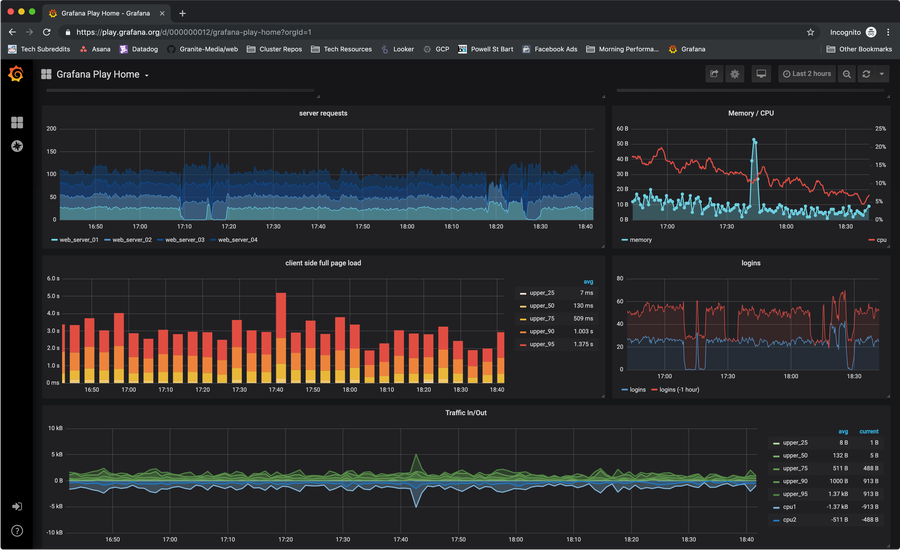
What is Grafana?
Grafana is an open source platform for visualizing time series data. It is often used as a front-end for Prometheus (and many other data sources).
What is Prometheus Operator?
Prometheus Operator is a set of resource definitions provided to create, configure, and manage Prometheus in a Kubernetes cluster.
As you can see, Prometheus and Grafana are a great, open source, set of tools for monitoring your Kubernetes cluster. In this guide, I’ll show you how to install prometheus-operator using helm, and start monitoring your cluster in just a few minutes.
1 – Install using helm
We’ll be installing prometheus-operator using this helm chart. According to the chart description, the default installation is sufficient for monitoring whichever cluster its deployed into.
However, if desired, there are plenty of values that can be configured. But for this guide, we’re going to install prometheus-operator with the default configuration.
Upgrade helm, if necessary
This may not be required, but I’m going to put it here just in case. You may need to upgrade helm before installing.
helm init --upgradeInstall the prometheus-operator chart
helm install stable/prometheus-operator --namespace monitoring --name prometheusIn the command above, I’ve run the basic helm install command but also specified the name and the namespace. Otherwise, you’ll get a random release name (something like old-camel or simple-cactus), and it will be installed in the default namespace.
You might be disappointed to hear, but that’s it! You’ve installed Prometheus and Grafana in your k8s cluster. In subsequent steps, I’ll provide a few more tips on getting logged in and set up.
2 – Logging in to Grafana
Get the password
To log in to the Grafana dashboard, you need to grab the admin password:
kubectl get secret --namespace monitoring prometheus-grafana -o jsonpath="{.data.admin-password}" | base64 --decode ; echoForward port 80
This chart creates a grafana service running on port 80. I’m going to use this service to forward port 3000 on our local machine to one of the grafana pods.
k port-forward -n monitoring service/prometheus-grafana 3000:80Log in at localhost:3000
Open a browser, and navigate to http://localhost:3000. There you can log in using:
| Username | Password |
|---|---|
| admin | (the password you retrieved in the first part of this step) |
Did you know Kubernetes is compatible with Superset? Check out this guide to install Apache Superset on a GKE Kubernetes Cluster.